These posts are part lab notebook, part “how I’d explain this to a busy
engineering manager or CISO.” Everything here is safe to share, but
still grounded in real technology and real work.
Building my first production website: from an idea to a real deployment
I built and launched a real public website for Najmi Travel, connecting frontend design, review data, a serverless API, database-backed moderation, DNS, SSL, and production routing into one end-to-end project.
Post #13 · · Serverless / Web Tools
Building my Chicago Event Scanner with Cloudflare Workers
I turned a real-life weekend problem into a serverless event discovery tool: a searchable Chicago events table powered by a Cloudflare Worker, KV cache, cron scans, cleanup logic, and user-focused filters.
Post #12 · · Open Source / Productivity
UpdateMeNow: building a faster way to stay informed
I built UpdateMeNow because staying current across news, alerts, and industry updates can quietly consume hours. This post explains the motivation, open-source direction, modular design, lightweight web version, and sample output.
Post #11 · · Home Lab / Cybersecurity
HOME-SHIELD: the CLI project that started with one noisy home network
I built a Python CLI to measure, harden, and re-measure home/IoT exposure — and the best part has been hearing real security pros say they needed something like this too.
Post #10 · · Hardware / Wireless Security
Flipper Zero field notes: turning curiosity into an ethical wireless lab
I finally grabbed a Flipper Zero and started testing what it can (and shouldn’t) do. This post is a practical, ethics-first rundown of what I learned across Bluetooth, BadUSB, Wi-Fi, and where I’m going next with Sub-GHz and access control.
Post #9 · · DFIR / Home Lab
A WannaCry-inspired DFIR lab (safe simulation) with FortiGate
A portfolio DFIR case study: simulate ransomware-like activity safely, capture disk + memory, analyze with Autopsy/Volatility, and contain lateral movement with FortiGate.
Post #8 · · Home Lab / Network Security
The night Wireshark made me question my own network
A baseline capture turned into a quick DNS-beaconing investigation — and a permanent upgrade to how I monitor my home lab.
Post #7 · · Windows / Security
How a customer tip led me to rediscover the unquoted service path vulnerability
Reproducing a “classic” Windows misconfiguration, separating signal from noise, and why exploitability depends on the surrounding posture.
Post #6 ·
Building and testing a honeypot with FortiGate
I deployed Cowrie behind a FortiGate VIP, then monitored live sessions with FortiView and exported logs to FortiAnalyzer.
Post #5 · · AI / Lab
Local LLMs with Runpod & LM Studio: easier than installing an agent
Notes from running local models on my laptop and in the cloud — and
why spinning up a GPU sometimes feels simpler than “productivity”
software.
Post #4 · · Home Lab / Network Security
Segmenting IoT on a FortiWiFi 60F: less noise, smaller blast radius
I moved smart-home devices onto an isolated SSID, tuned 2.4 GHz settings
for legacy clients, and built deny-by-default firewall rules with explicit
allowlists for only what IoT actually needs.
Post #3 · · Home Lab / Virtualization
Proxmox on an old server: failures, fixes, and first wins
I tried ESXi, pivoted to Proxmox VE, fixed a broadcast-IP mistake, and
got my first Kali VM running smoothly (VirtIO, QEMU agent, and a few
package-signing lessons along the way).
Post #2 · · Entrepreneurship / Defense Tech
Stretching innovation: my entrepreneurial journey with NSIN and FedTech
Customer discovery, rapid pivots, and what it feels like to pressure-test a DoD patent into a real product narrative.
Post #1 · · Story
UHI sales increase: getting creative with data, not just cold calls
My first sales role, no experience, a flat territory, and how
obsessing over real inventory and pricing data unlocked growth
during COVID.
Building my first production website: from an idea to a real deployment
Post #14 · · Production Web / Serverless
I recently built and launched my first production website from scratch.
This was not a school-style demo, a local test project, or a landing page that only exists for practice. It was a real public-facing website for a family travel business, intended to support actual visitors, trip inquiries, contact flows, photos, and reviews.
Before this project, I had experience around websites and production systems, but mostly from the operational and troubleshooting side. I understood concepts like DNS, SSL, routing, backend issues, user flows, and production impact. But managing or troubleshooting systems is very different from creating one from the ground up.
Building the entire site forced me to connect all of those pieces together myself.
Starting with the problem
The original goal was simple: modernize an older travel website and reduce the amount of manual work required to maintain it.
The previous setup had information scattered across different places. Reviews existed across multiple sources. Content was not organized in a way that made the user journey feel clear. The site did not fully represent the experience being offered to travelers.
I wanted the new version to feel more intentional.
The business focuses heavily on guided travel to religious and meaningful destinations, so I did not want the website to feel like a generic travel template. I wanted the first impression to feel warm, guided, and connected to the purpose of the trips.
That led to one of my earliest design ideas: the homepage should feel like the visitor is moving toward a mosque as they scroll.
That visual concept became the emotional direction of the site.
Planning before code
The biggest lesson from this project was that planning came before code.
It was tempting to start building immediately, but I knew that would create problems later. Before writing much of the site, I mapped out the core pieces:
What pages the site needed
How users should move through the site
What information should be easy to find
How contact and inquiry flows should work
How reviews should be displayed
How new reviews should be submitted
What should require approval before being public
What could fail without breaking the whole site
What security decisions needed to be made early
That planning stage mattered more than I expected.
A website is not just a set of pages. It is a system of paths, expectations, data, and failure points. Even a small public website needs architectural decisions.
For this project, the goal was not to over-engineer. The goal was to keep the system maintainable while still making production-minded choices from the beginning.
Building the frontend MVP
The first version was a static MVP.
I built the core pages first: home, trip sections, contact areas, photos, and reviews. The site needed to work across devices, so responsive layout was a priority from the start. I wanted the mobile experience to be clean because many users would likely visit from their phones.
The frontend included:
Responsive page structure
Navigation across the main sections
Trip cards and seasonal trip information
Contact-focused call-to-action areas
Photo and review pages
Scroll-based visual experience
Fallback behavior for certain dynamic features
The homepage was the most creative part of the build.
I spent a lot of time thinking about how the experience should feel, not just how it should look. The scrolling interaction, spacing, visual pacing, and movement all mattered. I wanted visitors to feel like they were being guided toward a destination, not simply reading a brochure.
That part reminded me that frontend development is not just layout and styling. It is user experience, storytelling, and emotional design.
The reviews problem
The reviews system became one of the most important parts of the project.
The challenge was that reviews were not in one clean location. They were spread across multiple places: public review platforms, older web pages, and different parts of the existing web presence.
That meant I had to treat reviews as a data problem, not just a content problem.
I needed to collect them, clean them, organize them, preserve useful metadata, and structure them in a way that could support the new site.
The review data needed to answer questions like:
Who submitted the review?
What was the review text?
Was there a source or context?
Was the review approved for public display?
Was it imported from older content or submitted through the new site?
When was it created or approved?
What type of travel experience did it relate to?
Once I started thinking about reviews this way, the project became more than a static website. It needed a backend.
Moving from static content to a backend
At first, I could have hardcoded reviews into the page. That would have been easier, but it would not have solved the long-term problem.
I wanted the website to support a better review workflow:
Public visitors should only see approved reviews.
New submissions should not appear instantly.
New reviews should be saved as pending.
Admin approval should be required before publishing.
The review data should live in a real database.
The frontend should not contain private approval logic.
Admin secrets should never be exposed in public JavaScript.
That led me to build a small serverless backend for the review system.
The architecture became:
Public website       → static frontend
/api/reviews         → serverless API
Review database      → structured review records
Admin endpoints      → token-protected moderation workflow
This separation was important.
The frontend is responsible for display and user interaction. The backend is responsible for validating requests, reading approved reviews, saving pending submissions, and protecting admin actions. The database is responsible for persistence.
That gave the site a much cleaner structure than hardcoded content.
Security-first decisions
Even though this was a small website, I wanted to make security-conscious decisions from the beginning.
Some of the security-focused choices included:
New public review submissions are not automatically published.
Admin actions require a private token.
Secrets are stored server-side, not in frontend code.
Public read behavior is separated from admin moderation behavior.
Only approved records are returned to public visitors.
The frontend includes fallback behavior if the API is unavailable.
API testing was done directly instead of relying only on browser behavior.
The review form may seem simple, but public input always deserves caution. Even when the risk feels small, the design should assume that anything submitted publicly is untrusted.
The goal was not to build an enterprise-grade platform. The goal was to avoid basic mistakes and keep the public surface area controlled.
Data migration and database setup
One of the most useful parts of this project was organizing existing reviews into a structured database.
Because the review data came from multiple sources, I had to normalize it. That meant turning scattered review content into consistent fields that the website and API could work with.
The database design included fields for things like:
Review ID
Review status
Reviewer name
Review text
Rating, where available
Review type or category
Source metadata
Created timestamp
Updated timestamp
Approval timestamp
The status field was especially important because it drives the moderation workflow.
A review can be pending, approved, or rejected. Public visitors only receive approved records from the API. New submissions enter the system as pending.
This created a clean approval model and made the frontend easier to reason about.
The production cutover
Once the MVP and backend were working, the next challenge was production deployment.
This was where the project became very real.
Moving a domain is not just “point it somewhere.” There are multiple layers involved:
DNS hosting
Nameservers
DNS records
SSL certificate provisioning
Static hosting
API routing
Proxy behavior
Route precedence
The new site loaded successfully after the DNS migration, but the review API did not work correctly at first.
When I tested the API path directly, I expected JSON.
Instead, the request returned the frontend HTML.
That was the clue.
It meant the domain was resolving and the static site was working, but the API route was not being intercepted by the backend worker. In other words, the browser was reaching the website, but /api/reviews was falling through to the static frontend instead of being handled by the API.
Production lesson: DNS working does not mean application routing is working.
A domain can resolve perfectly while a specific path is still going to the wrong place.
Fixing the API route
The fix was to explicitly route API traffic to the backend worker.
The final pattern looked like this:
domain.com          → static frontend
domain.com/api/*    → serverless API worker
API worker          → database
That route separation was the key.
The frontend and backend shared the same domain, but they needed different routing behavior. The static site should handle normal page requests. The API worker should handle requests under /api/*.
Once that route was added correctly, direct API tests returned JSON instead of HTML, and the review workflow could communicate with the database as intended.
This was one of the best learning moments of the project because it connected DNS, routing, frontend behavior, backend behavior, and debugging into one problem.
What this project touched
By the end, the project had touched more areas than I originally expected:
Frontend design
Responsive layouts
User experience planning
Static site deployment
Serverless API design
Database schema design
Review data cleanup
Review metadata organization
Moderation workflow
Admin token protection
DNS migration
SSL setup
Route precedence
API endpoint testing
Production troubleshooting
Fallback behavior for degraded states
The most valuable part was not any single tool. It was learning how all the pieces interact.
A working page does not prove the backend works.
A working domain does not prove routes are correct.
A working API does not prove the frontend is consuming it properly.
A working database does not prove new writes are being approved and displayed correctly.
Each layer has to be tested directly.
Lessons learned
The biggest lesson was that production exposes assumptions.
In local development, it is easy to assume something works because the page loads. In production, each layer needs to be validated:
Does the domain resolve correctly?
Is SSL active?
Is the static site loading from the expected deployment?
Is the API route hitting the backend?
Is the backend connected to the correct database?
Are writes being stored?
Are pending records hidden from public users?
Are approved records visible?
Are secrets kept out of the client?
This project also reinforced that simple architecture is powerful when it is planned well.
I did not need a complicated system. I needed a maintainable one.
A static frontend, a small serverless API, a structured database, and explicit routing were enough to solve the problem cleanly.
Final thoughts
I went into this project with no real experience building a production website from scratch.
I came out with a working public site, a database-backed review system, a serverless API, a safer review moderation workflow, and a much deeper understanding of how frontend, backend, DNS, SSL, and routing connect in the real world.
The most rewarding part was that this was not just a lab.
It was useful.
It helped modernize a real business, organize scattered review data, reduce manual processes, and create a better experience for visitors.
And from a technical perspective, it gave me exactly what I wanted: a real production problem to solve from end to end.
Building my Chicago Event Scanner with Cloudflare Workers
Post #13 · · Serverless / Web Tools
The idea for my Chicago Event Scanner came from a very normal problem: my wife and I would be looking for something to do in Chicago, and the search always felt more random than it needed to be. She might send me something from Instagram, I might find a page through search, and then we would both end up jumping between event calendars, park pages, venue listings, and screenshots trying to decide what was actually worth doing.
As someone who is used to running scans, writing commands, and setting up automated jobs, that workflow started to feel like a problem I should be able to make cleaner. I kept thinking: what if I could pull upcoming Chicago events into one place, normalize the messy parts, and give the site a simple way to search, filter, and browse them?
That became the Chicago Event Scanner, a project on my personal website that combines serverless backend automation with a frontend table built for real browsing.
Turning a weekend search problem into a system
I did not want the tool to be another huge app or an open-ended scraper. I wanted something practical: a page that could show upcoming events, let me narrow results quickly, and avoid refreshing live source websites every time someone opened my site. The final user experience is intentionally straightforward. Visitors can filter events by date, location, category, price, source, and age group, then scan the results in a table that is easier to work with than a pile of tabs.
The technical challenge was connecting the kind of backend automation I am comfortable with to a real website in a way that stayed fast, safe, and maintainable. That is where Cloudflare Workers fit well.
The architecture
The architecture is simple, but it solves the important parts of the problem:
Frontend: HTML, CSS, and vanilla JavaScript on my personal website.
Backend: a Cloudflare Worker that handles event scans and API responses.
Storage: Cloudflare KV for the latest normalized event JSON.
Automation: a Cloudflare Cron Trigger that refreshes results on a schedule.
The frontend does not scrape third-party websites directly. Instead, it calls my own API endpoint. The Worker is responsible for fetching approved public sources, cleaning the returned data, normalizing it into a consistent structure, and saving the latest result to KV.
That design keeps the page lightweight. A normal visitor is not triggering a fresh scan across source websites every time they load the project page. They are mostly reading the most recent cached scan, which makes the site faster and avoids unnecessary requests to the original sources.
The scan flow
The backend flow looks like this:
Cloudflare Cron Trigger runs on a schedule.
The Worker fetches approved public event sources.
Raw event data is cleaned and normalized.
Past events are removed.
Duplicate events are reduced.
Results are sorted by date.
The latest event JSON is saved to Cloudflare KV.
The website displays the saved results through the frontend table.
I also added a manual scan option, but with cooldown protection. That gives me a way to refresh results when needed without turning the Worker into something that can be spammed from the public site.
Cleaning messy event data
A big part of the project ended up being data cleanup. Event data can look clean on a website but messy when it comes back through feeds or embedded data. Some fields included raw HTML tags, escaped characters, double-encoded entities, or formatting that made sense on the source page but looked rough inside my table.
To make the results readable, I added cleanup logic before saving the final output. The Worker strips unsafe or unnecessary markup, decodes HTML entities, normalizes text fields, validates links, and shapes each event into the same general format. That step matters because the frontend should not have to guess whether a title, location, description, or source field is safe and readable.
Adding filters that match real life
One of the best improvements came from Zahra's feedback. She pointed out that events are not useful to everyone in the same way. Parents, families, kids, adults, and seniors may all be searching for different kinds of activities, even when they are looking at the same city.
That pushed me to add age group support. Now the scanner can help surface events that are better suited for kids, families, adults, seniors, or all ages. It is a small feature technically, but it makes the tool feel more practical because it reflects how people actually make plans.
Keeping the design careful
From a security and design perspective, I tried to keep the project realistic. The Worker only fetches approved sources. The frontend does not expose secrets or API keys. Cached results are used instead of scraping every time a page loads. Manual scans have cooldown protection. The tool is not designed to be an open scraper, proxy, or generic fetch endpoint.
That boundary is important. Building useful automation does not mean making the most aggressive scraper possible. For this project, the better design was a controlled pipeline: approved sources in, cleaned normalized results out, and a public frontend that only displays what the backend has already prepared.
What I learned
This project taught me a lot about building a practical serverless web tool. I got hands-on experience with Cloudflare Workers, KV storage, Cron Triggers, API routes, frontend-to-backend communication, caching, filtering, search, data normalization, and safer scraping patterns.
More importantly, it reminded me that useful technical projects usually start with a real friction point. This was not just about building a scraper. It was about taking a scattered decision-making process and turning it into a small event discovery system that is faster, cleaner, and more organized.
I also included a sample Excel export for anyone who wants to see what the scanner output looks like outside the website table. You can download the example here: Chicago Event Scanner sample export.
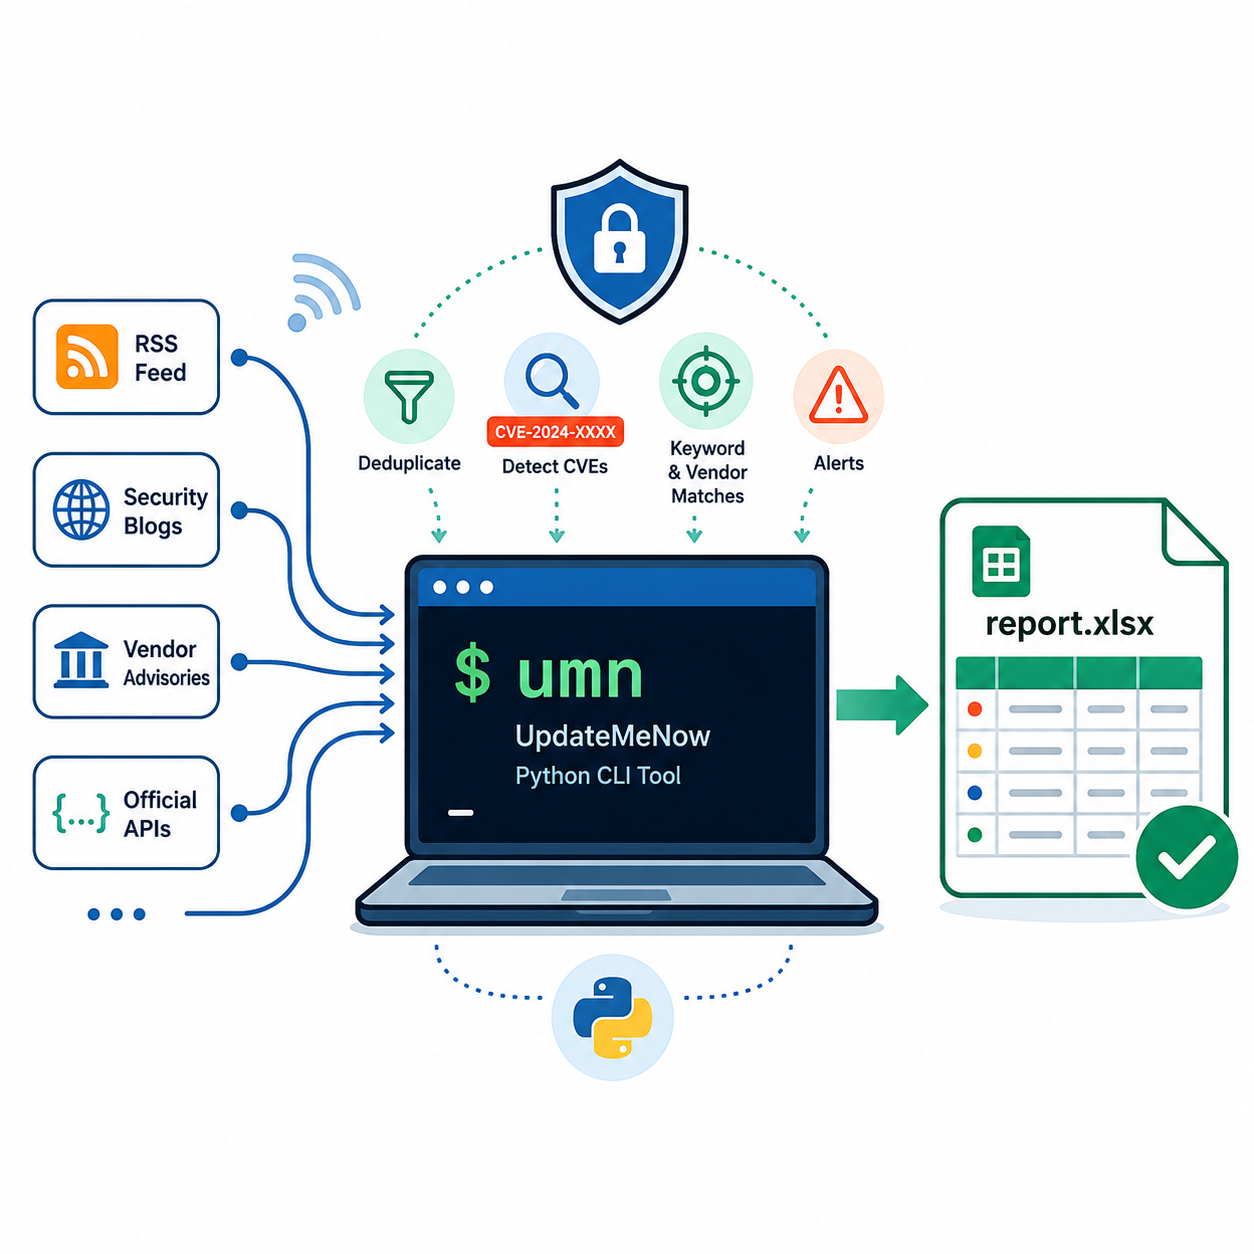
UpdateMeNow: building a faster way to stay informed
Post #12 · · Open Source / Productivity
Staying updated sounds simple until it becomes part of the daily routine. Between news sources, industry updates, alerts, research feeds, and general information I want to keep an eye on, one catch-up session can easily take 30 minutes to an hour. Doing that multiple times a day becomes a real time-management problem.
UpdateMeNow came from that pressure point. I wanted a faster way to understand what changed and what deserved attention without repeatedly jumping between different websites, sources, and feeds. The goal was not to replace careful reading. The goal was to reduce friction so the first pass could happen faster and feel more organized.
The problem: information overload and time cost
The hard part about staying informed is not only the amount of information. It is the context switching. One source might have breaking news, another might have industry-specific updates, another might have alerts, and another might have useful background reading. By the time I check each place and decide what matters, I have already spent a meaningful block of time.
That adds up quickly. If every catch-up cycle takes 30 minutes to an hour, the workflow becomes difficult to maintain alongside school, work, projects, and normal daily responsibilities. I have always been interested in efficiency, saving time, and finding better workflows, so this felt like the kind of problem worth turning into a project.
Why I built UpdateMeNow
I built UpdateMeNow because I wanted a more manageable way to stay informed throughout the day. Instead of manually visiting the same sources over and over, I wanted a tool that could help shorten the process, organize the results, and make the act of checking updates feel less scattered.
The motivation was practical. I wanted a workflow that matched how I actually work: quick enough to use regularly, organized enough to review later, and flexible enough to grow as I find new use cases. UpdateMeNow is my attempt to turn that idea into something useful.
Why open source matters
I also wanted the project to be open source. Part of that decision is transparency: people should be able to understand what the tool is doing and how it is structured. Another part is learning. Open-source projects let others use the tool, study it, improve it, or adapt it for their own needs.
Projects like this are rarely finished in one version. The best ideas often come from real usage, feedback, and new perspectives. By keeping UpdateMeNow open, I can keep improving it while making it easier for others to build on the same concept.
Setup and getting started
A tool is only useful if people can actually try it, so setup and accessibility are important parts of the project. I want UpdateMeNow to be approachable for someone who is curious about the idea, not only for someone who already understands the codebase. Installation and setup documentation make the project easier to evaluate, run, and modify.
This is an area I expect to keep improving. Clearer setup instructions, better examples, and smoother onboarding all help someone understand what the tool does, get it running, and decide whether it fits their workflow.
Modularity and future use cases
One of the most important design ideas behind UpdateMeNow is modularity. Although the tool may start with news or general updates, the broader concept can apply to many industries. The core idea is simple: collect useful updates, organize them, and make review faster.
Medical professionals could adapt the concept for healthcare updates, research summaries, or clinical information feeds.
Cybersecurity and IT teams could use it for threat intelligence, vendor updates, product advisories, or operational alerts.
Weather-focused users could use it for location-based alerts, severe weather updates, or quick local condition summaries.
Business users could track market, finance, competitor, or industry news.
Students and researchers could follow academic topics, publications, or subject-specific updates.
I am especially interested in exploring the weather side of the tool in the future. Weather-location support, severe weather updates, and quick local condition summaries all feel like natural extensions because they fit the same problem: people need timely information, but they do not always have time to dig through multiple sources.
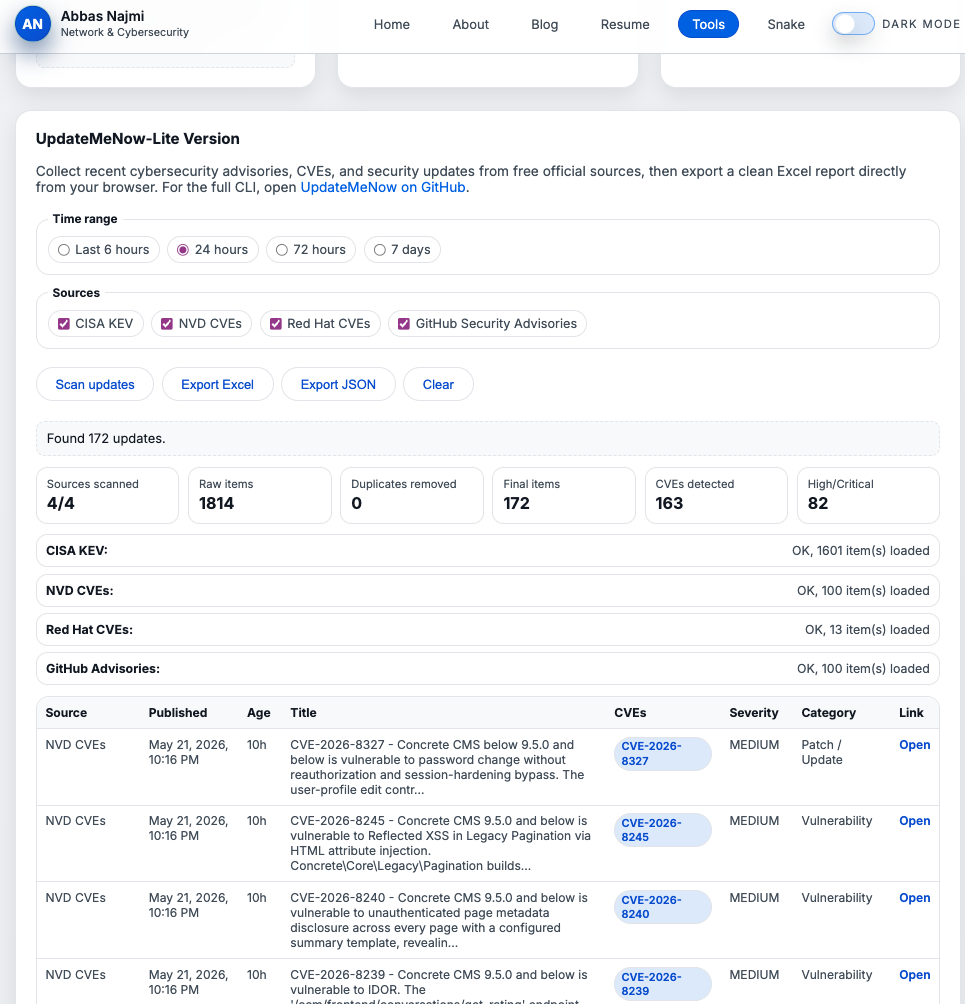
The lightweight web version
After an idea from a teammate, I added a lightweight web version of UpdateMeNow to my personal website. That gives me an easy-access option when I am on another device, do not have the full tool installed, or am using my phone. It is not meant to replace the full tool. It is meant to be convenient when I need quick access.
I like that balance. The full project can grow with more structure and capability, while the web version stays simple and accessible. Sometimes the best workflow is the one that is available when you need it.
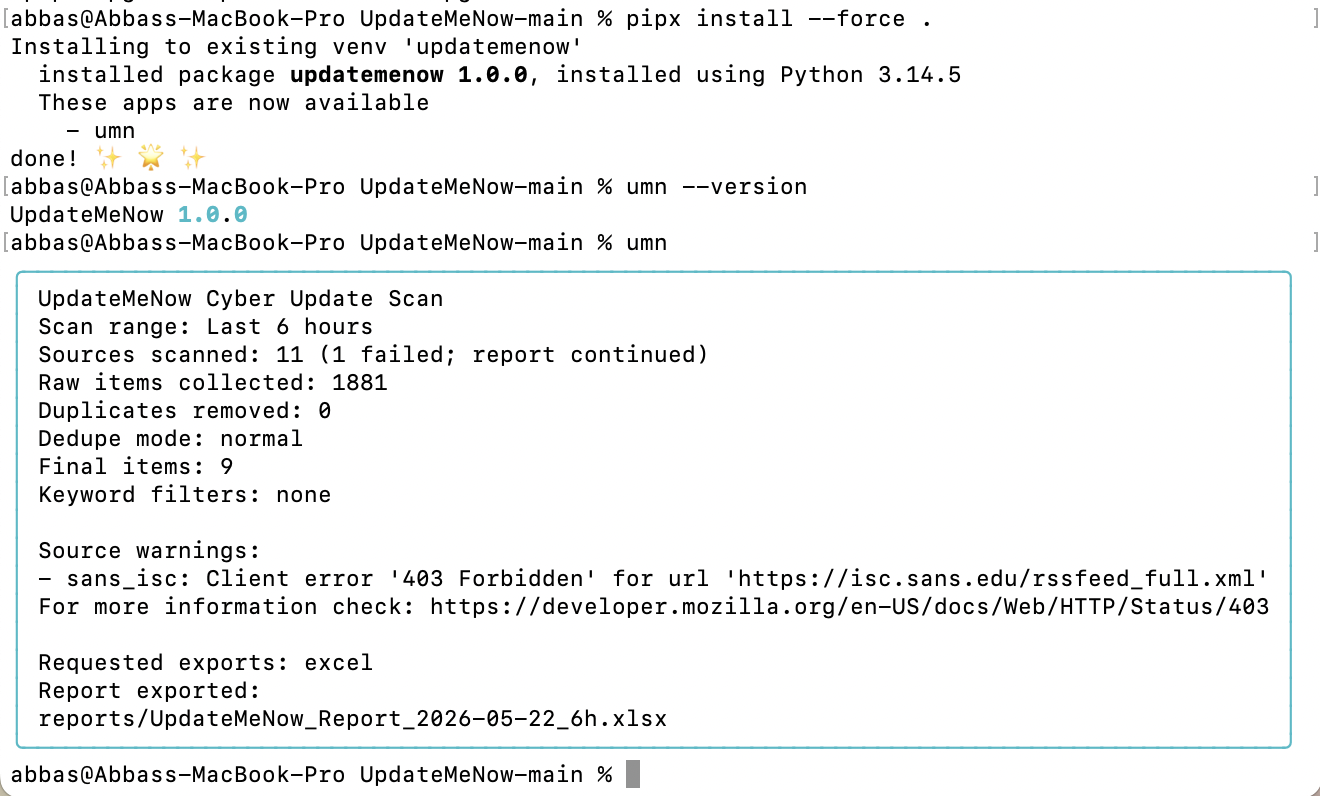
Sample output and exporting
UpdateMeNow can provide organized results, and I included a sample export file named umnexport.xlsx for anyone who wants to see what an exported result can look like. I think of it as an example output rather than a big feature claim. It is there for transparency and demonstration, so readers can review the type of organized result the tool can generate.
Future improvements
The future of UpdateMeNow is about making the workflow more useful without making it unnecessarily complicated. I want to keep improving setup, documentation, source flexibility, and output organization while exploring more modular use cases, especially around weather and location-based updates.
More broadly, I see UpdateMeNow as a project about reducing friction. If the tool can save time, help users focus, and give people a clearer starting point for deeper reading, then it is doing its job.
Conclusion
UpdateMeNow started from a simple personal problem: staying updated was taking too much time across too many places. Building it gave me a way to turn that frustration into a more efficient workflow, and making it open source gives others the chance to use it, learn from it, or shape it into something that fits their own needs. It is still a project with room to grow, but the direction is clear: make staying informed faster, cleaner, and more manageable.
HOME-SHIELD: the CLI project that started with one noisy home network
Post #11 · · Home Lab / Cybersecurity
HOME-SHIELD started with a question that sounds simple, but gets surprisingly messy once you actually try to answer it:
after I segment my home network, how do I know it actually worked?
Like a lot of home-lab projects, this one began with curiosity and a little bit of suspicion. I had smart-home devices, personal devices,
work devices, an ISP router, a FortiWiFi 60F, multiple SSIDs, and enough multicast noise to make Wireshark feel like a group chat that
nobody asked to join. Everything technically worked, but I wanted more than a router dashboard telling me devices were “connected.”
I wanted evidence.
The big idea: HOME-SHIELD is not trying to exploit anything. It measures what is visible and reachable from a specific
point in the network, then helps compare before-and-after results after a hardening change.
The problem I kept running into
Home networks have quietly become tiny enterprise networks. We have cameras, TVs, speakers, plugs, phones, laptops, game consoles,
printers, hubs, and random devices that all want to discover each other automatically. That convenience is great until you start asking
security questions: Which devices are still visible? Which ports are reachable? Did my IoT SSID actually reduce exposure, or did I just
make myself feel better?
The frustrating part is that many consumer routers do not give you a clean answer. They may show which device is connected to which
SSID, but they do not always show whether discovery protocols like mDNS and SSDP are still visible across a boundary, or whether a
web interface is still reachable from a segment that should not need access.
So I built a workflow: Measure → Harden → Re-measure
HOME-SHIELD is built around a workflow I wish more home network tools used: take a baseline, make a change, then measure again.
Instead of guessing whether segmentation helped, the tool gives you a comparison.
Measure: collect discovery and TCP reachability data from the current network vantage point.
Harden: adjust firewall rules, SSIDs, VLAN behavior, client isolation, multicast handling, or service exposure.
Re-measure: run the scan again and compare what changed.
Report: generate a readable HTML summary instead of making someone decode raw terminal output.
Under the hood, the tool is a Python CLI because Python made the project easier to keep modular: discovery, reachability checks,
diff logic, report generation, and optional packet-capture parsing can each live in their own lane. That mattered to me because this
was not just a one-off script. I wanted something I could keep extending.
What HOME-SHIELD actually checks
For discovery, HOME-SHIELD looks at common home/IoT protocols like mDNS and SSDP. These are the protocols
behind a lot of “it just finds the device” magic. For reachability, it checks focused TCP ports that matter in home and IoT environments,
including web interfaces, file sharing, streaming, and IoT messaging.
80 / 443: HTTP and HTTPS dashboards, APIs, and embedded web services.
445: SMB file sharing, which is important from a lateral-movement perspective.
554: RTSP streaming, commonly seen around cameras and media devices.
1883: MQTT, common in IoT and home automation setups.
Simple but useful: The goal is not to scan every port on earth. The goal is to validate whether the services that matter
to a home/IoT security story are still visible or reachable after a change.
The first time the report felt real
The coolest moment was seeing HOME-SHIELD turn messy network observations into a before-and-after story. In my final project run,
the exposure score improved from 55 to 58. mDNS responders dropped from 9 to 6, open TCP ports dropped
from 5 to 4, and two previously open services were closed.
But the report also caught something important: one new HTTPS service appeared on a different host. That was exactly the kind of
finding I wanted the tool to preserve. A good validation tool should not just cheer because the score went up. It should also point
at the weird thing that still deserves investigation.
The feedback has been one of the best parts
One of the most encouraging parts of this project has been showing it to real security professionals and hearing their reactions.
A lot of the feedback was not just “cool project.” It was more like: there is actually a need for something like this.
Some people even mentioned that they had looked for a tool like this before — something lightweight, practical, and focused on
validating home or SOHO network exposure — but could not find anything that fit the use case. That feedback meant a lot because
it confirmed the original instinct behind HOME-SHIELD: the gap is real. People can configure networks, but they still need a simple
way to prove what changed.
Personal win: It has been amazing to see this move from a class project into something security people immediately
understand and can imagine using in real home-lab or SOHO environments.
What I learned building it
Segmentation is not a feeling: it should be measured from the actual place users and devices sit.
Discovery traffic tells stories: mDNS and SSDP can reveal more about a network than people expect.
Reports matter: raw JSON is useful, but a readable HTML report makes the findings easier to explain.
New exposure can appear during hardening: fixing one thing does not mean the whole environment is perfect.
Small networks deserve serious tools: home and SOHO networks are not “too small to matter.”
Where I want to take it next
HOME-SHIELD is already useful, but I can see a lot of ways to make it stronger: support for more discovery protocols, better charts,
Windows support, historical exposure trends, device classification, policy-aware scoring, and easier packaging for people who do
not want to think about Python environments.
The long-term goal is simple: make home network hardening easier to prove. Not by turning every homeowner into a SOC analyst,
but by giving curious users, students, and small-network defenders a practical way to answer: what changed, what improved,
and what still needs attention?
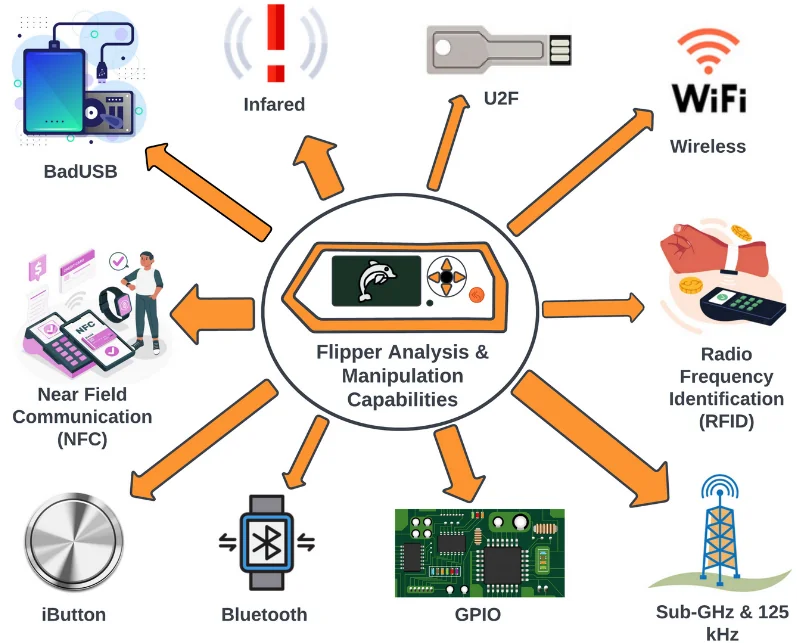
Flipper Zero field notes: turning curiosity into an ethical wireless lab
Post #10 · · Hardware / Wireless Security
Ethics & scope: Everything here is framed for authorized testing on my own gear (or with explicit permission).
I’m intentionally not publishing step-by-step instructions for breaking into networks, stealing credentials, or targeting other people’s devices.
If you’re learning with a Flipper, build a lab you’re allowed to break — it’s more fun, and you actually learn the right lessons.
Why the Flipper is so fun (and why it needs rules)
The Flipper Zero feels like a “Swiss Army knife” for wireless and hardware-adjacent security. The coolest part is not “doing hacks” — it’s how fast it helps you
understand the real-world behavior of protocols you usually only read about: Bluetooth advertising, NFC taps, the difference between 2.4 GHz vs Sub‑GHz,
and what your devices do when they think they’re talking to something trusted.
The flip side is obvious: the same convenience can be misused. So I treated this like a home lab project — define scope, document what I observed,
and focus on what a defender or builder should do next.
My starter lab setup
Isolated test network: a dedicated SSID/VLAN with no access to anything important.
Only my devices: spare phone, spare laptop, and a couple of cheap IoT targets that I own.
Logging: router logs + a laptop for packet captures and notes.
Goal: learn the protocol behaviors and the defenses — not “gotchas.”
Bluetooth: the “it’s fine… until it isn’t” layer
Bluetooth is everywhere, and a lot of people leave it enabled 24/7. What surprised me most wasn’t some Hollywood exploit — it was how many small,
messy configuration issues show up in the real world: old pairings, devices left discoverable, and people forgetting what they’ve authorized.
Defensive checks (quick commands):
# Linux: inspect + clean up Bluetooth pairings
bluetoothctl devices
bluetoothctl paired-devices
bluetoothctl info <MAC>
bluetoothctl remove <MAC>

# macOS: dump Bluetooth state (built-in)
system_profiler SPBluetoothDataType
Tip: if a device is “acting weird”, removing old pairings and re-pairing cleanly fixes more problems than people expect.
BadUSB: why “trusting keyboards” is a security smell
BadUSB-style attacks work because operating systems treat new HID devices (like keyboards) as inherently trusted input. That’s a huge assumption.
The right takeaway isn’t “wow, scary!” — it’s that you should protect high-value machines from surprise peripherals.
Hardening idea (Linux): allowlist USB devices with USBGuard so unknown devices can’t just show up as a keyboard.
# Install + generate a baseline policy
sudo apt-get install usbguard
sudo usbguard generate-policy | sudo tee /etc/usbguard/rules.conf

# Check what the machine is seeing
usbguard list-devices
If you’re on Windows in a managed environment, the “device installation restrictions” policies are the enterprise equivalent.
Wi‑Fi dev board: what it taught me about rogue networks
The Wi‑Fi attachment is where the Flipper stops feeling like a toy. Even without doing anything “fancy,” it forces you to think about a hard truth:
users mostly connect based on a name (SSID), not an identity they can verify. That’s exactly why rogue access points and “evil twin” style attacks exist.
I’m not going to publish instructions for creating fake networks or capturing passwords. But I will share the defender perspective I learned the hard way:
if a device auto-joins “Starbucks WiFi” just because it recognizes the name, that’s a risk decision the user didn’t realize they were making.
Defensive checks (spotting suspicious Wi‑Fi):
# Linux: list nearby networks with BSSID + security
nmcli -f IN-USE,SSID,BSSID,CHAN,RATE,SIGNAL,SECURITY dev wifi list

# Windows: show networks + BSSIDs
netsh wlan show networks mode=bssid

# macOS: scan nearby APs
/System/Library/PrivateFrameworks/Apple80211.framework/Versions/Current/Resources/airport -s
Compare BSSID: “same SSID, different BSSID” can be normal — or a rogue AP.
Watch security mode: if your usual network is WPA3 and you suddenly see an “open” version, be suspicious.
Disable auto-join for public networks; use a VPN on untrusted Wi‑Fi.
Sub‑GHz + access control: the next frontier (carefully)
I’m starting to explore Sub‑GHz theory (315/433/868/915 MHz ranges, modulation basics, rolling codes vs fixed codes) and access control concepts (NFC/RFID, iButton, etc.).
I haven’t done key cloning experiments — and if I ever do in a lab, it’ll be on my own hardware with clear documentation and legal constraints.
Defender mindset:
Prefer rolling codes / modern protocols for remotes and entry systems (fixed codes age poorly).
Use MFA where possible (U2F/FIDO keys for accounts, not “tap-and-go” alone).
Assume RF is observable: design for interception, not secrecy.
What I’m doing next
Build a repeatable “wireless lab” checklist (scope, logging, test targets, and safe reset steps).
Document defenses alongside every experiment — especially around Wi‑Fi and Bluetooth hygiene.
Learn Sub‑GHz basics with legal/owned devices and a “measure first” mindset.
Write a follow-up once I’ve done more structured experiments and can share clean lessons.
Quick reminder: If you’re testing anything wireless, do it on networks/devices you own or have written permission to test. The best security projects are the ones you can proudly show a hiring manager — and that means ethics-first.
Honesty + Safety: This is a WannaCry-inspired defensive lab write-up for learning and portfolio documentation.
I did not detonate real WannaCry, and I’m not providing instructions to obtain or run live ransomware.
Instead, I used a harmless simulator to generate ransomware-like artifacts (bursty file activity + predictable “.encrypted” markers + SMB attempt telemetry)
and then practiced containment + DFIR on the results.
Lab environment
I ran this on Proxmox with multiple VLANs to prove segmentation and containment decisions using FortiGate verification (sessions/logs/debug tools).
VLAN10 USERS — 192.168.10.0/24 (victim workstation + Kali observer)
VLAN20 SERVERS — 192.168.20.0/24 (file server / SMB share target)
The primary control tested was a default deny for SMB (TCP/445) from USERS → SERVERS. This reduces a common ransomware
lateral movement path (file shares, admin shares, and “server hunting” over SMB).
Policy order + least privilege: FortiGate policies are evaluated top-down.
I placed the deny rule above any broad allow rules. In a real environment, I would also tighten src/dst objects wherever possible.
Configure the deny policy (FortiGate CLI)
config firewall policy
    edit 10
        set name "Deny-SMB-Users-to-Servers"
        set srcintf "VLAN10"
        set dstintf "VLAN20"
        set srcaddr "all"
        set dstaddr "all"
        set action deny
        set service "SMB"          # TCP/445
        set schedule "always"
        set logtraffic all
    next
end
Verify enforcement (sessions + debug flow)
Instead of relying on ad-hoc session commands, I verified SMB blocking using FortiOS session-table filters and debug flow output.
1) Session-table check (expected: no established SMB sessions)
diagnose sniffer packet any "host 192.168.20.10 and port 445" 4 0 a
Safe simulation (ransomware-like behavior)
Rather than running live malware, I used a harmless simulator to generate measurable artifacts and network telemetry:
Creates safe, non-destructive .encrypted copies of test files
Generates bursty file I/O patterns for timeline review
Attempts an SMB access to generate blocked telemetry on FortiGate
Simulator script (PowerShell)
# RansomwareSimulator.ps1 (safe simulator)
$testPath = "C:\Users\Public\TestFiles"
$share    = "\\192.168.20.10\share"   # adjust to your lab share

# 1) Generate SMB telemetry (safe): attempt to access the share
try {
    Get-ChildItem -Path $share -ErrorAction Stop | Out-Null
    Write-Host "SMB access succeeded (unexpected if deny policy is active)."
} catch {
    Write-Host "SMB access failed/blocked (expected in this lab)."
}

# 2) Generate “encryption-like” artifacts (safe): copy files to *.encrypted
$testFiles = Get-ChildItem -Path $testPath -File -ErrorAction Stop
foreach ($file in $testFiles) {
    $encryptedFile = "$($file.DirectoryName)\$($file.Name).encrypted"
    Copy-Item -Path $file.FullName -Destination $encryptedFile -Force
    Start-Sleep -Milliseconds 100
    Write-Host "Encrypted (simulated): $($file.Name)"
}
Evidence acquisition
I acquired evidence and analyzed it on a separate analysis VM (never analyze on the “infected” box). Since the victim was a VM,
disk acquisition was done in a VM-centric way (snapshot/export/clone) and then hashed.
Preserve state (power off or snapshot)
Export/clone disk to an analysis location
Hash artifacts (SHA-256) and document values
Example hash step (analysis VM)
sha256sum /mnt/analysis/victim_disk.img
Memory capture (Windows)
For a Windows victim, I used a Windows memory acquisition tool (e.g., WinPmem/DumpIt or equivalent) and then hashed the resulting dump.
Get-FileHash -Algorithm SHA256 C:\memory_dump.raw
Disk forensics (Autopsy)
Autopsy was used via the GUI workflow:
Create a case on the analysis VM
Add the acquired disk image
Run ingest modules
Use Timeline to identify bursty file activity
Keyword search for .encrypted to find simulator artifacts
Memory forensics (Volatility)
Volatility was used to identify suspicious execution context (process list + command line) and to review network artifacts where supported.
Educational use only: No real WannaCry or other malicious software was executed. All steps were designed to be non-destructive and lab-safe.
Building and Testing a Honeypot with FortiGate Firewall
Post #6 ·
As part of my cybersecurity research and hands-on network security projects, I built and tested a honeypot using a FortiGate firewall.
The goal was to simulate a vulnerable system that could attract and log unauthorized access attempts — without exposing my internal network.
Project overview
Objective: Deploy a honeypot behind a FortiGate firewall to simulate a vulnerable host.
Honeypot: Cowrie (SSH/Telnet).
Environment: FortiGate 80F (FortiOS 7.6), Ubuntu Server 22.04 (Cowrie), Kali Linux (internal testing).
Setup process
Step 1: Deploy the honeypot (Cowrie)
Cowrie was installed on an Ubuntu VM with IP 192.168.100.10. Installation steps:
I mapped a public-facing IP to the honeypot’s internal IP:
VIP configuration: config firewall vip edit "honeypot-vip" set extip 203.0.113.5 set extintf "wan1" set mappedip "192.168.100.10" next end
Step 3: Allow external access via a firewall policy
Policy: config firewall policy edit 100 set name "Allow-Honeypot" set srcintf "wan1" set dstintf "internal" set srcaddr "all" set dstaddr "honeypot-vip" set action accept set schedule "always" set service "ALL" set logtraffic all next end
Testing the honeypot
From my Kali Linux VM (192.168.100.25), I attempted to SSH into the honeypot VIP:
SSH test: ssh root@203.0.113.5
Cowrie captured and logged the attempt and created a TTY log for later review:
Session check: diagnose sys session list | grep 192.168.100.10
To ensure traffic logging was enabled:
Logging: config log setting set status enable set logtraffic start-stop end
From there, I reviewed connection attempts in FortiView and exported logs to FortiAnalyzer for correlation and longer-term analysis.
Outcome
The honeypot successfully attracted SSH probes and basic scans. All actions were recorded without endangering the internal network,
and I validated end-to-end visibility from inbound policy hits to honeypot-level command logging.
Takeaway: Honeypots are most useful when they are isolated, heavily logged, and easy to reset — the goal is visibility, not “fighting back.”
Final thoughts
This project sharpened my FortiGate CLI skills and gave me practical experience with threat emulation, packet logging, and network deception techniques.
It’s a strong addition to my cybersecurity lab portfolio — and a foundation I can extend with FortiAnalyzer/FortiSIEM integrations over time.
UHI sales increase: learning to sell by thinking like a customer
Post #1 · · Story
Walking into sales with no playbook
When I first joined United Hose Inc., I didn’t come from a traditional
sales background. No polished script, no massive Rolodex, no secret list
of “accounts ready to buy.” I did what everyone around me seemed to be
doing... cold calls, email blasts, following up on stale leads, and it
felt like shouting into the void.
The pressure was real. Numbers needed to move, and “try harder” wasn’t
a strategy. I knew if I just kept doing the same surface level outreach,
I’d get the same surface level results.
Constraint: No big marketing engine, no pre-warmed leads,
and a territory that wasn’t exactly booming. I had to find leverage
somewhere else.
Acting like a buyer to understand the game
Instead of only acting like a salesperson, I started thinking like a
customer. If I were running a shop, what would I actually care about?
Price, sure — but also who has stock today, who can deliver when things
break, and who understands my world enough not to waste my time.
So I started calling the people who were selling to my customers and
prospects every day. I asked the kinds of questions a real buyer
would ask: what’s on the shelf, what’s moving, and what it costs out
the door. Over time, those calls turned into something valuable:
a living database of what the market really looked like — not just
what a spreadsheet said it should look like.
Territory snapshot: TX / OK / NM / LA
Map loads when you open this post. Pins highlight the markets I focused on most.
Turning messy notes into a quiet advantage
I started tracking everything. If a competitor was consistently pricing
a certain hose at one level, and I knew our cost structure and service
was strong, I could be intentional about where to undercut, where to
match, and where to walk away.
This wasn’t about racing to the bottom; it was about being precise.
Instead of “we’re cheaper,” I could have targeted conversations:
“On these five SKUs, I know I can save you money without sacrificing
quality or lead time. Let’s talk about those first.”
Result: My territory went from flat to growing, even
during COVID. For a first-time sales rep, that wasn’t just a nice
chart — it was proof that I could figure out a new problem from
first principles.
What that experience taught me
That role at UHI was my first real sales job, and watching the numbers
move because of a system I built gave me a huge confidence boost. It
showed me that I didn’t need to be the loudest person in the room;
I just needed to be the most curious about how the system actually
worked.
Eventually, that mindset pulled me toward tech. I joined a startup
focused on helping manufacturers turn downtime into something they
could actually measure and plan around — not just complain about
after the fact. The same pattern showed up again:
Understand the real problem beneath the surface metrics.
Collect better data than anyone else in the room has.
Translate that data into decisions people feel confident making.
Looking back, UHI was where I learned that data, curiosity, and
empathy for the customer can beat a polished script. That lesson
still shows up in how I approach networking, security, and every
“this is how we’ve always done it” conversation I run into.
Setting up Proxmox on my home server: failures, fixes, and first wins
Post #3 · · Home Lab / Virtualization
The goal
I wanted to bring an older server back to life as a small home lab: a
hypervisor I could trust, a place to run security VMs (Kali, Ubuntu),
and enough flexibility to experiment without constantly rebuilding the
base OS. The end state was simple: clean virtualization, predictable
networking, and a workflow that feels “lab-ready.”
Target outcome: A stable Proxmox host with at least one
working VM (Kali) and a clear path to add Ubuntu + Docker workloads next.
Step 1: I tried ESXi first (and learned why people call it “enterprise”)
My first attempt was VMware ESXi. I hit friction immediately: I grabbed
a ZIP instead of a bootable ISO, Rufus didn’t like it, and the “right”
way forward involved building a custom installer image. ESXi is
powerful — but for a quick home-lab build, the workflow felt heavier
than I needed.
Lesson: Sometimes the best technical choice is the one
you can deploy and maintain confidently. For my lab, “approachable”
beat “industry standard.”
Step 2: Pivot to Proxmox VE (much smoother)
Proxmox was the opposite experience: download the ISO, make a bootable
USB, install, and you’re online. The high-level steps were:
Download: Proxmox VE ISO (from the official site).
Create USB: Rufus to write the ISO to a USB drive.
Boot: Select USB at boot (commonly F11 or Del).
Install: Set hostname, admin email, password, and management networking.
Networking gotcha: the “.255” mistake
During install I initially configured the host IP as 10.0.0.255.
That failed because .255 is typically reserved as the broadcast
address in a /24 network. I corrected it to:
10.0.0.10/24, with gateway 10.0.0.1 and DNS set to a
public resolver.
Reminder: Avoid .0 and .255 host
addressing on common subnet sizes — it’s an easy mistake that breaks connectivity fast.
Logging in: where it “clicked”
After reboot, the Proxmox web UI came up on port 8006:
https://<server-ip>:8006. The default login pattern is
root with the Linux PAM realm. The interface is
straightforward — and that’s where the build stopped feeling fragile and
started feeling operational.
My first VM: Kali Linux
Once the host was stable, I uploaded the Kali ISO to the Proxmox storage
and created a VM with a modest baseline:
CPU: 2 vCPUs
Memory: 4 GB
Disk: 32 GB
Boot: CD-ROM first (Kali ISO)
During install, GRUB asked for a target device; selecting the primary
disk (/dev/sda) completed the setup cleanly.
Performance tuning: the VM stopped feeling “heavy”
The first boot was usable but sluggish. A few Proxmox-side changes made a
noticeable difference:
Enable QEMU Guest Agent (better integration and reporting).
Use VirtIO for disk and network where possible.
Switch display to Spice and use a modern machine type (e.g., q35).
Issues I hit (and how I resolved them)
Two issues were common “first-lab” pain: package signing keys and third-party repos.
For an apt GPG key error like:
NO_PUBKEY ED65462EC8D5E4C5, I imported the missing key from a keyserver.
Fix example: sudo apt-key adv --keyserver keyserver.ubuntu.com --recv-keys ED65462EC8D5E4C5
Note: apt-key is deprecated on newer Debian/Ubuntu releases, but it can still
be useful for quick lab troubleshooting. Long-term, prefer keyrings under
/etc/apt/keyrings.
For Docker installs, I added Docker’s official repository to avoid outdated packages:
Proxmox is home-lab friendly without sacrificing serious capability.
Networking details matter (CIDR, gateway, and reserved addresses).
Error messages are signals — treat them like a checklist, not a dead end.
Storage hygiene is easy in Proxmox: VMs and disks can be reclaimed cleanly from the UI.
Where I am now
Proxmox is stable, Kali is running with a responsive GUI, and the next step is
adding an Ubuntu VM to host local LLM experiments and Docker apps. The bigger win
is that I now have a repeatable process: I can build, break, fix, and rebuild
quickly — which is exactly what a good lab is for.
Local LLMs with Runpod & LM Studio: Easier Than I Expected
Post #5 · · AI / Lab
Why I Cared About Local Models (And Why You Should Too)
AI is everywhere, but most of it lives behind someone else’s API key. That’s fine for some use cases, but as a security-minded person—and occasionally a CISO—I wanted to see what it felt like to run models closer to home: either on my own machine or on infrastructure I could trust.
I assumed it would be hard. “Local LLMs?” I thought. “That’ll involve compiling code, wrestling with Docker, and probably a few late-night debugging sessions.” But when I started experimenting, I was surprised to find that setting up a local model—or renting a cloud GPU—was often easier than dealing with some so-called “productivity agents” that promise magic but require five browser extensions just to install.
Experiment: Try two approaches side by side—a local desktop tool (LM Studio) and a cloud GPU provider (Runpod)—and see how hard it really is to get something useful running, from model installation to image generation speeds. (Spoiler: It’s easier than you think.)
LM Studio: The “VS Code for Local LLMs”
LM Studio felt like the “VS Code for local LLMs.” I installed it, opened it up, and was greeted with a catalog of models. No Docker compose files, no YAML forests—just a search bar and a download button.
My first test? Mistral 7B. I searched for it, hit download, and within minutes, I was chatting with the model locally. No latency, no data leaving my machine. Next, I tried Llama 2 (13B parameters). The process was the same: search, download, and wait for the initial setup (which took about 5 minutes on my M2 MacBook Pro).
Once a model was downloaded, I could:
Chat with it directly inside the app—no API keys, no remote dependencies.
Expose it as a local API endpoint to integrate it into my workflows (e.g., for note-taking or analysis tools).
Switch between models without rebuilding anything—just a click and wait.
For lightweight tasks like note-taking or quick analysis, this was more than enough. But I also tested image generation with Stable Diffusion 2.1. On my laptop, generating a 512x512 image took ~20 seconds, and my fan sounded like it was about to take off.
Runpod: Renting a GPU for Heavy Lifting
The other side of the experiment was Runpod. I wanted to see if renting a cloud GPU could handle heavier workloads—like generating high-res images or running larger LLMs—without my laptop overheating.
The process was straightforward:
Pick a template (e.g., “Stable Diffusion” or “Hugging Face Inference”).
Choose a GPU. I started with an A10G ($1.20/hour) for lighter tasks, then upgraded to an A6000 ($4.80/hour) when I needed more power.
Launch the pod and SSH in within minutes. No waiting for Docker containers to build—just a terminal session ready to go.
Once the pod was up, I could run containers, host APIs, or even train models. The best part? No need to buy a GPU for weekend experiments—I could spin it down when done and only pay for the time I used.
Testing Performance: Speed, Privacy, and Control
I put both platforms through their paces to see how they stacked up:
Text Generation:
LM Studio: Blazing fast for local use, but latency increased with larger models. Llama 2 (13B) took ~5 seconds per response on my M2 MacBook Pro.
Runpod: Matched or beat LM Studio’s speed when using a GPU (e.g., ~3 seconds per response on an A6000).
Image Generation:
LM Studio: Generating a 512x512 image with Stable Diffusion took ~20 seconds, and my laptop fan sounded like it was about to take off.
Runpod (A6000): Dropped to ~8 seconds—no fan noise, just pure performance.
Privacy and Control:
LM Studio: Running entirely locally meant no data ever left my machine. Perfect for sensitive tasks like note-taking or internal analysis.
Runpod: While it’s in the cloud, I could SSH into the pod and verify what was running. No black-box APIs—just a remote machine I controlled.
So… Which One “Wins”?
For me, it’s not either/or:
LM Studio wins when I want fast, simple, local experiments where privacy and convenience matter. It’s perfect for:
Note-taking or quick analysis without sending data to a third party.
Offline tinkering—no internet required, no API rate limits.
Experimenting with different models without rebuilding my setup.
Runpod wins when I want more horsepower on demand, especially for heavier workloads or when I don’t want my laptop fans sounding like a jet engine. It’s ideal for:
Image generation or video work (e.g., Stable Diffusion at 1024x1024 resolution).
Running larger models (e.g., Mixtral 8x7B) without maxing out my local GPU.
Avoiding the cost of buying a GPU I’ll only use on weekends.
The funny part is that in both cases, getting something useful running was often easier than dealing with some “productivity agents” that promise magic but require five browser extensions and a small ceremony to install. I tried one recently—just to see—and the installation process involved more steps than setting up LM Studio or Runpod.
Why This Matters for CISOs (And Security-Minded Folks)
As someone who’s spent time in security—especially as a CISO—I care about control, visibility, and avoiding single points of failure. Here’s why local LLMs or rented GPUs are interesting from that perspective:
No API Keys, No Third-Party Risks: Running models locally (or on infrastructure you control) means no need to expose your data to external APIs. That’s a big deal if you’re handling sensitive information.
Visibility and Auditability: With LM Studio or Runpod, you can see exactly what’s running, how it’s configured, and even inspect the code if needed. No black boxes.
Avoiding Vendor Lock-in: Some AI tools lock you into their ecosystem. Local models or cloud GPUs give you the flexibility to switch tools without being stuck.
Cost Control: Renting a GPU by the hour (e.g., on Runpod) means you only pay for what you use—no surprise bills from over-provisioned cloud services.
Long term, I like having both options. Just like in networking, it’s about picking the right tool for the job—and understanding enough about what’s under the hood that you’re not surprised when things scale, break, or need to be secured properly.
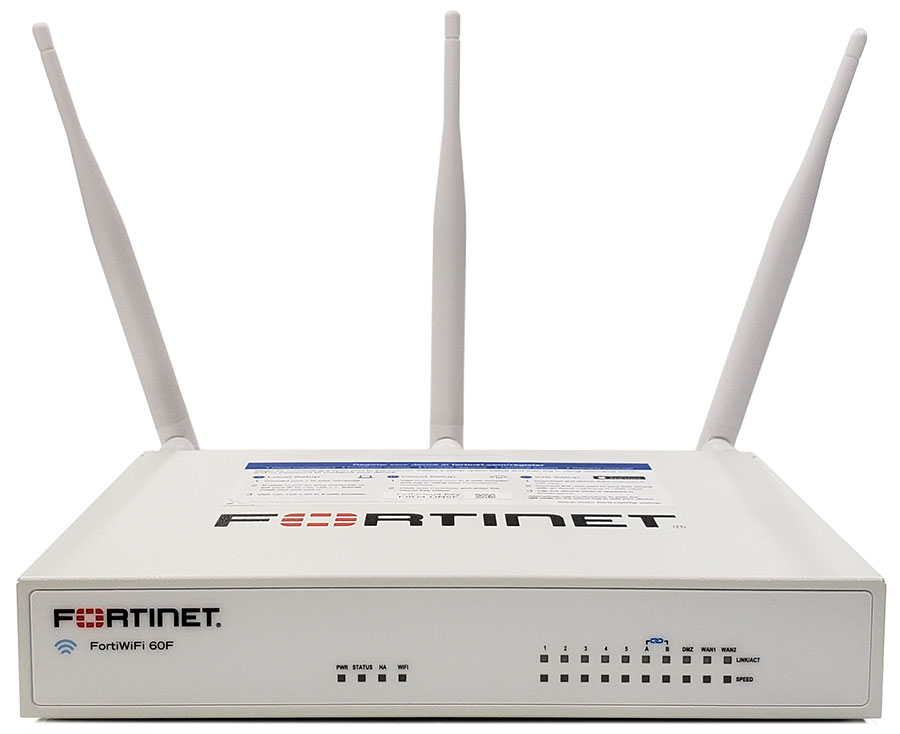
Segmenting IoT on a FortiWiFi 60F: less noise, smaller blast radius
Post #4 · · Home Lab / Network Security
Why I split IoT off my primary network
Over time I ended up with a lot of “always-on” devices: smart plugs, lights, outlets,
an alarm clock, speakers, TVs — the usual modern home stack. When I started doing packet captures
on my home network, it was obvious these devices generate steady background traffic
(DNS lookups, NTP time sync, cloud telemetry, periodic update checks, and a good amount of
broadcast / multicast chatter).
None of that is automatically “bad,” but it creates two problems: visibility gets noisy,
and the blast radius grows. If any single IoT device is compromised, a flat home network
makes it easier for that compromise to pivot laterally.
Goal: Keep IoT functional, but isolate it from trusted endpoints and reduce
unnecessary east/west reachability.
The approach: separate SSID + segmentation policies
I chose a FortiWiFi 60F so routing, Wi-Fi, and policy enforcement could live in one place.
I created a dedicated IoT SSID treated like its own security zone, then built firewall rules
around a simple principle: deny by default, allow only what’s needed, and log the rest.
Dedicated IoT SSID: smart-home devices connect here, not on my primary SSID.
Isolation boundary: IoT cannot initiate connections into the trusted LAN.
Explicit allowlists: permit only required services (DNS, NTP, and HTTPS as needed).
Logging: keep policy logs enabled so unusual patterns stand out quickly.
The 2.4 GHz compatibility issue (and what I changed)
The main friction point was that several devices were 2.4 GHz-only and fairly picky about
“legacy-friendly” Wi-Fi settings. A few would fail to join, or would join and drop intermittently.
The fix was to tune the IoT SSID for compatibility.
Fix: I adjusted the IoT SSID/radio settings to be more tolerant of older 2.4 GHz clients:
ensuring 2.4 GHz support was enabled, using a narrower channel width where appropriate, and avoiding
newer-only modes that some IoT clients struggle to negotiate reliably.
Firewall rules: what I allowed and what I blocked
After devices were stable on the new SSID, the security work was mostly policy design. I used a simple
policy stack:
Allow: IoT → DNS (to the resolvers I trust)
Allow: IoT → NTP (time sync)
Allow: IoT → HTTPS (firmware updates and normal cloud control)
Deny + log: IoT → Trusted LAN (no lateral access)
What improved immediately
The biggest win was clarity. My trusted network captures became quieter and more meaningful, and any
noisy or unusual IoT behavior is now scoped to its own segment. The second win is risk management:
even if a device is vulnerable, it’s fenced into a network that can’t freely reach the rest of the house.
Takeaway: Segmentation is just as valuable at home as it is in enterprise —
it keeps the network understandable and the failure domain contained.
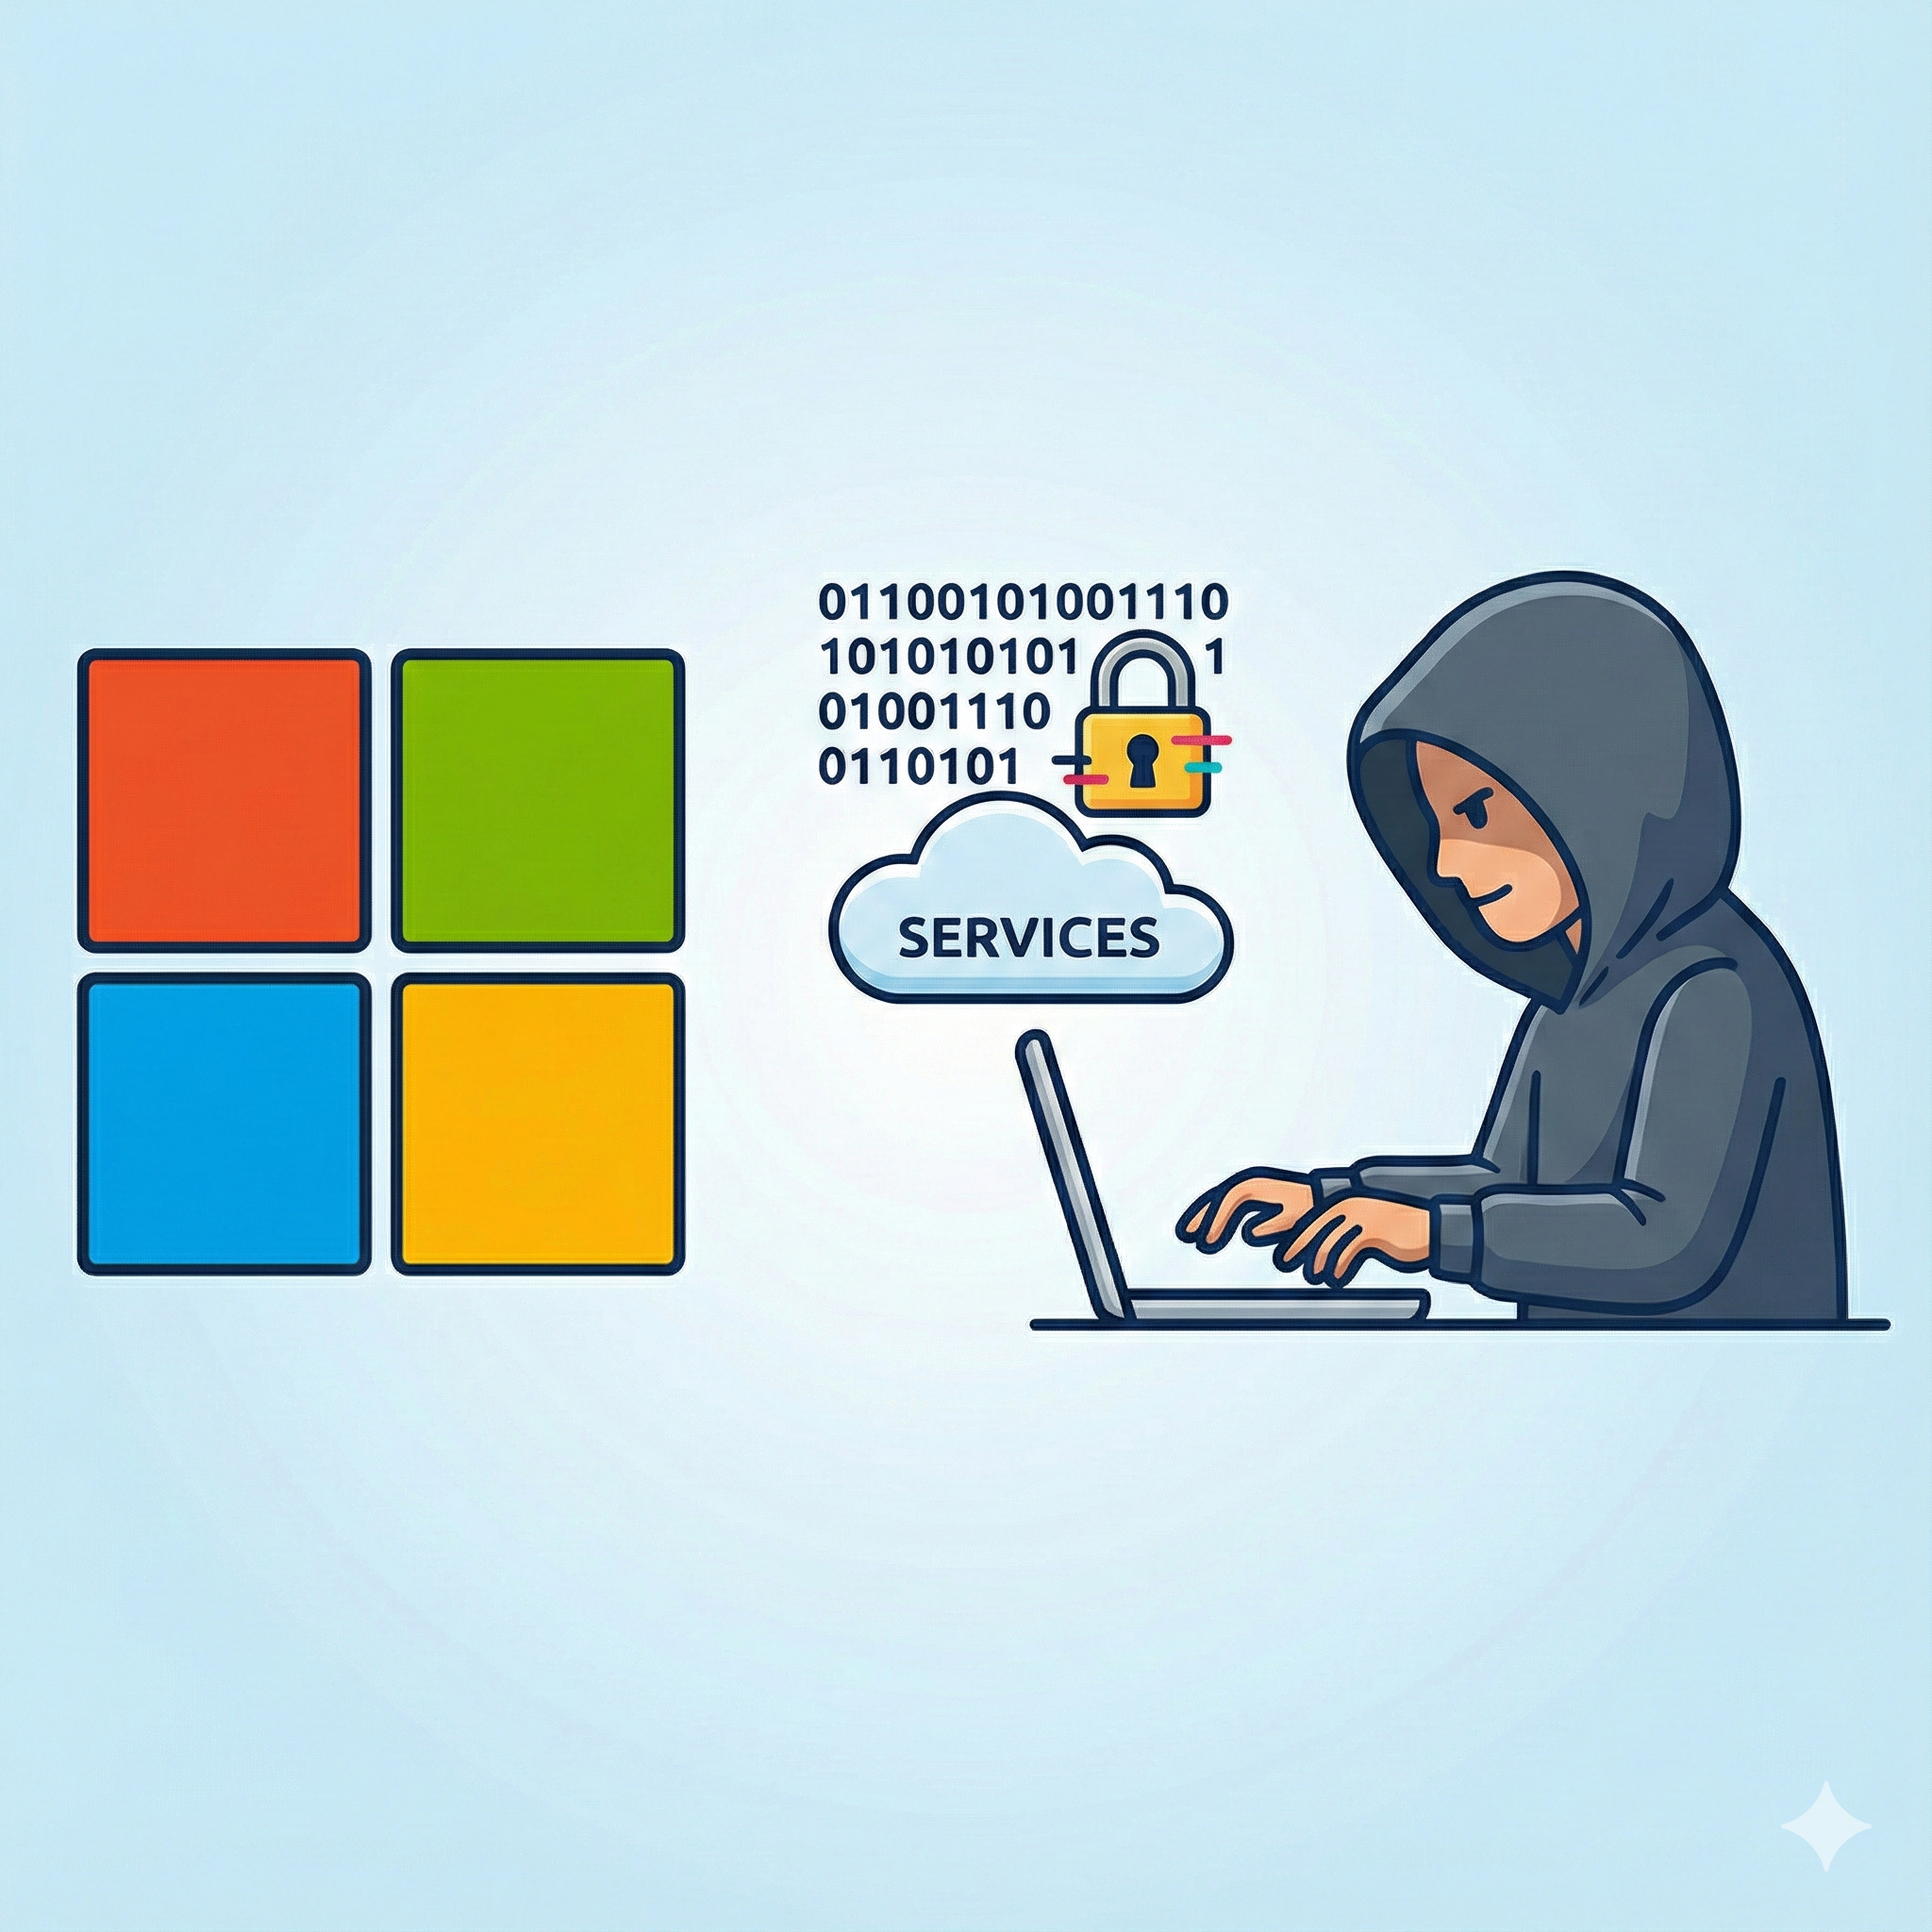
How a Customer Tip Led Me to Rediscover the Unquoted Service Path Vulnerability
Post #7 · · Windows / Security
Sometimes, the most interesting discoveries start with a simple message from a customer.
Recently, a customer reached out reporting a potential vulnerability related to unquoted service paths. Curious, I decided to investigate — and to my surprise, I was able to reproduce the issue exactly as described. It was a moment that reminded me how even well-known bugs can surface in unexpected places.
What Is the Unquoted Service Path Vulnerability?
For those unfamiliar, the unquoted service path vulnerability is a classic Windows misconfiguration. When a service executable path includes spaces and isn't wrapped in quotation marks, Windows may misinterpret the command. This can lead to unintended execution of malicious files if they're planted in predictable paths.
For example, if a service is registered like this:
Without quotes, Windows will first attempt to run:
C:\Program.exe
Then C:\Program Files\Vulnerable.exe
And finally C:\Program Files\Vulnerable Service\Service.exe
If an attacker can place a malicious Program.exe in C:\, it might get executed instead — but only if they already have elevated privileges to write to those directories.
My Reproduction
Using the steps outlined in this GitHub guide, I set up a test environment with:
A new service with an unquoted path
Write permissions granted to a non-admin user for the service directory
A dummy executable named Service.exe dropped into the path
After restarting the service, my dummy code executed successfully — validating the vulnerability in this (misconfigured) scenario.
Raymond walks through multiple examples of poorly understood — and sometimes outright false — vulnerability reports. Some of these reports flagged unexploitable issues, such as:
Paths that are already quoted
Services running with command-line arguments (which don’t need quotes)
Services installed in protected directories like C:\ProgramData or C:\Windows\System32
His conclusion? Quoting paths is best practice, but most of these scenarios are not exploitable unless the system is already misconfigured.
My Takeaway
This was a great reminder that:
Even “low-risk” issues are worth validating — especially if a customer flags them.
Security is as much about good hygiene as it is about exploitability.
Understanding the nuances of Windows services and paths is critical when assessing vulnerability reports.
Fixing these issues takes minutes — but not fixing them can lead to hours of explaining why they weren’t a risk …until they were.
Stretching Innovation: My Entrepreneurial Journey with NSIN and FedTech
Post #2 · · Entrepreneurship / Defense Tech
When I joined the National Security Innovation Network (NSIN) through the FedTech Foundry program, I wasn’t quite sure what to expect. All I knew was that I was being paired with a team and a Department of Defense researcher — someone who held a promising patent — and together we’d explore how to turn that invention into a viable, real-world product. We were competing with other teams for a shot at a grant to help launch a startup and bring our prototype to life. But as I quickly learned, the experience was far more than a competition — it was a crash course in innovation, pivoting under pressure, and understanding what real customer discovery looks like.
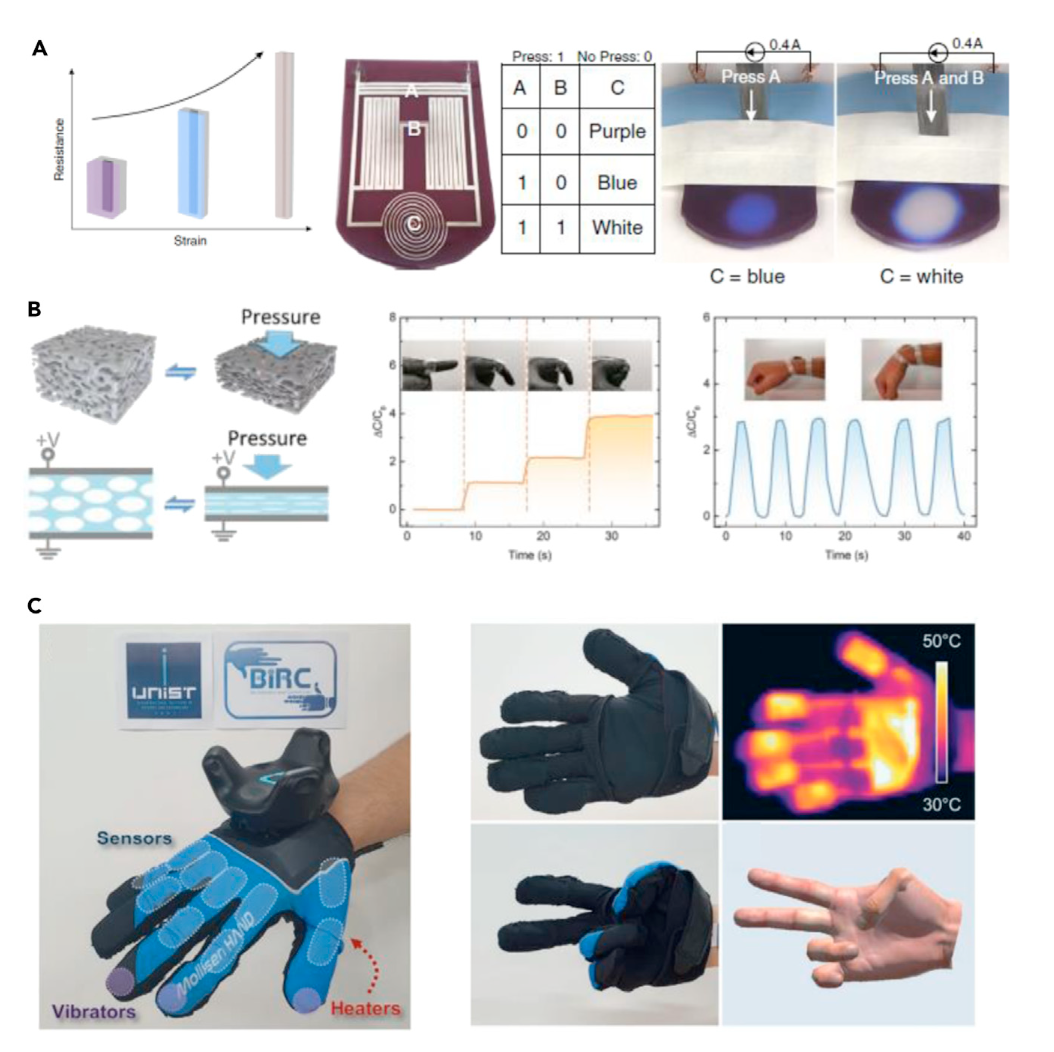
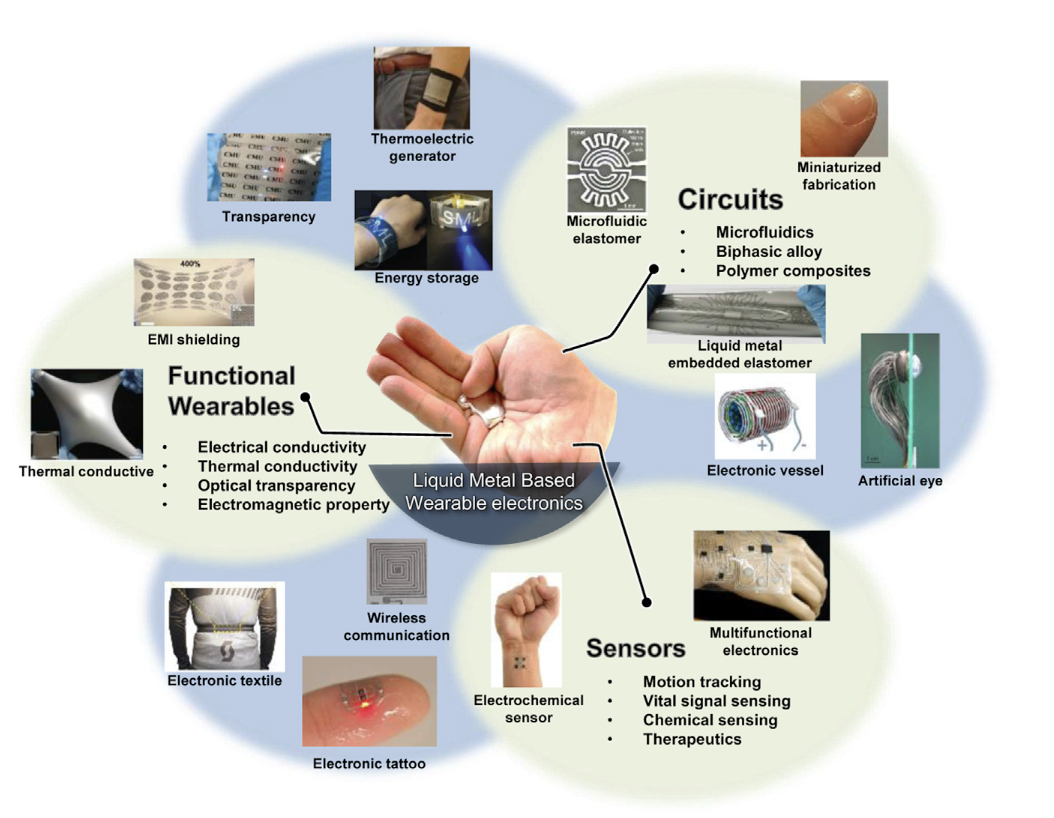
The Tech: A Flexible Silicone Sensor
Our team was assigned a fascinating piece of tech: a liquid-metal-based flexible silicone sensor embedded with soft materials. Unlike traditional rigid sensors, this one was stretchable, biofidelic, and could be embedded into soft materials to detect high-impact forces — think milliseconds-scale blast events or pressure changes. The original idea? Apply it to NFL helmets, helping detect concussions by measuring internal forces during impacts. It seemed like a great fit — literally and metaphorically.
The Pivot: From Football to Fighter Jets
But as we began interviewing potential users, especially within the Department of Defense, our thinking evolved. Through conversations with Air Force pilots, we discovered an entirely different — and possibly more impactful — use case: integrating the sensor technology into flight suits. The sensor’s ability to deform with the material and remain sensitive during extreme conditions made it a strong candidate for monitoring pressure, strain, and potential injuries in high-G or crash scenarios. This pivot not only changed our direction — it changed our mindset. We weren’t just repurposing technology; we were solving real operational pain points with defense relevance.
What We Built
With insights from military interviews and technical specs from the patent, we worked on positioning the flexible sensor as a platform technology. Potential applications ranged from:
Embedded sensors in protective gear (combat helmets, body armor)
Soft robotics and prosthetics with life-like tactile response
Medical wearables for high-fidelity strain and pressure sensing
While we didn't advance to the final grant round, our team was proud of the prototype concept and the groundwork we laid for future development.
The Real Wins: Skills, Insights, and Networks
Although we didn’t take home the top prize, I walked away with something just as valuable:
Deep understanding of customer discovery and market validation
Exposure to cutting-edge sensor technology
A new appreciation for the intersection of defense innovation and entrepreneurship
Lasting connections with researchers, mentors, and fellow entrepreneurs
The FedTech Foundry is more than a startup incubator. It's a proving ground — one where the process matters just as much as the product.
Final Thoughts
Innovation isn’t linear. Sometimes the best ideas emerge when you're forced to stretch — to reconsider assumptions, change direction, and build something that resonates with a user’s actual needs. That’s exactly what this experience gave me: the ability to stretch, adapt, and grow — not just as a team member, but as an entrepreneur.
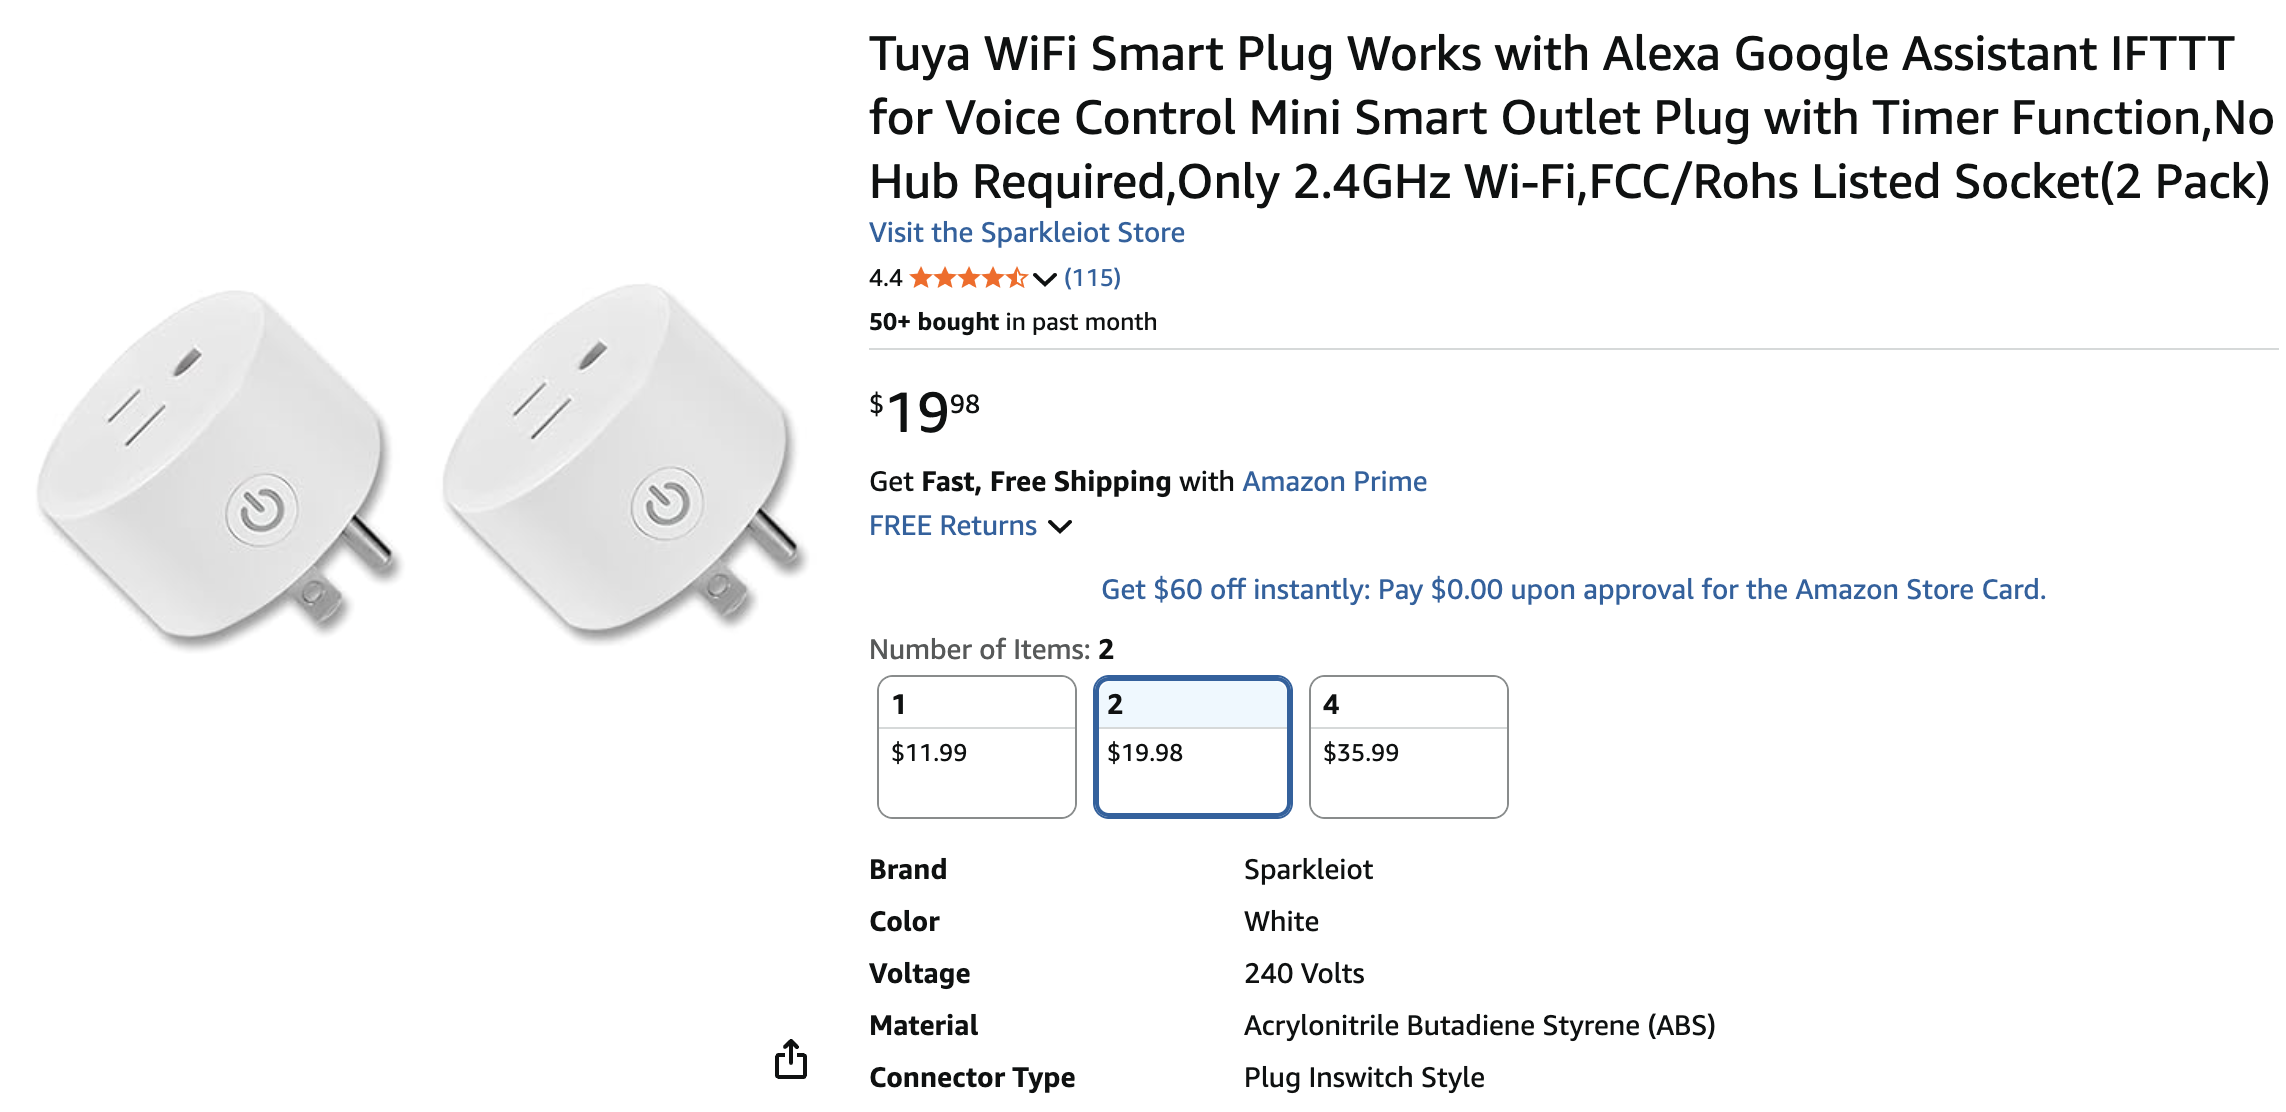
The night a smart outlet made me question my own network
Post #8 · · Home Lab / Network Security
This was not a dramatic “caught a hacker” story. It started with me doing the boring thing I try to do after any change
in my home lab: baseline traffic captures and sanity checks.
I had recently tightened segmentation between my Trusted LAN and my IoT segment, and I was in the middle of testing a new
smart outlet I bought online. Cheap, feature rich, and the kind of thing you convince yourself is fine because it is just a plug.
The outlet joined WiFi, the companion app paired quickly, and everything looked normal until I glanced at my capture.
One device was reaching out to a public IP I did not recognize: 221.233.52.33.
That was enough to slow me down and switch from “setup mode” to “verify mode.”
What made me stop and look
IoT devices talking to the internet is not automatically suspicious. Firmware checks, time sync, cloud control, telemetry,
all of that exists. What I pay attention to is consistency, timing, and whether the destination makes sense for the device
and for how I intend to use it.
The outlet initiated outbound connections without me controlling it.
The destination stayed consistent enough that it stood out in the endpoint list.
I saw repeated traffic involving 221.233.52.33.
The behavior continued even when I was not using the app.
I do not label something as malicious just because it feels weird. I try to turn “weird” into a short list of testable questions.
Who is talking. To where. How often. And does it stop when I remove cloud dependencies.
The capture workflow I use when IoT acts chatty
I keep this routine simple so I will actually do it every time.
1) Prove it is the outlet, not some other device
Wireshark: Statistics → Endpoints and filter for the outlet MAC address once you identify it.
Router or DHCP leases: map the outlet IP to a MAC and hostname label if your network provides one.
Sanity check the VLAN: confirm it is in the IoT segment and not accidentally on the Trusted LAN.
2) Focus on the one external destination that triggered the question
At this point I was not trying to “decrypt the traffic” or prove attacker intent. I only needed enough clarity to decide
whether to isolate the device and test what breaks when outbound access is restricted.
What I checked before assuming the worst
Before I called it “sketchy,” I ran the same three pivots I always run: confirm device identity, confirm the egress path,
and confirm whether the behavior is required for the features I actually want.
1) Confirm the outlet identity via neighbor tables
Windows: arp -a
macOS or Linux: arp -an or ip neigh
Router client list: match MAC address to the device that appeared when you paired it.
2) Confirm it is not bypassing your DNS visibility
If you run a local resolver, verify the IoT VLAN is actually using it.
If the device hardcodes DNS, you will see it talking to external resolvers directly (instead of your intended DNS).
On a segmented VLAN, force DNS to your resolver and block outbound DNS to the internet.
3) Test what happens when you block the destination
Temporarily block outbound to 221.233.52.33 for the IoT segment.
See what functionality breaks (pairing, scheduling, remote control), then decide whether you want that risk.
Digging deeper: Chinese actor tactics
The IP address 221.233.52.33 stood out for another reason - its geolocation. When I ran a quick whois check:
This confirmed the IP was located in China, a country known for state-sponsored cyber operations targeting Western infrastructure.
I then cross-referenced this with my local threat intelligence feed using:
While this wasn't definitive proof of malicious activity, it was enough to significantly raise my suspicion level.
Chinese actor groups are known for:
Using seemingly benign IoT devices as initial access points
Establishing persistent outbound connections for C2
Obfuscating traffic through legitimate-looking domains and IPs
Maintaining access even when not actively using the device's features
The consistent outbound connections to this Chinese IP, even when I wasn't interacting with the outlet, matched known APT behavior patterns.
Takeaway: If a device requires unrestricted outbound access to unknown endpoints, especially in geolocations tied to adversarial actors, isolate it immediately. Assume the worst until proven otherwise. When dealing with potential Chinese actor activity:
Check for multiple C2 beacons (outbound connections)
Verify if the device maintains persistence when not in use
Look for unusual DNS patterns or hardcoded IPs
Consider whether the risk outweighs the convenience of the device's features